Seafloor Atlas › About
How much of the ocean floor has actually been measured?
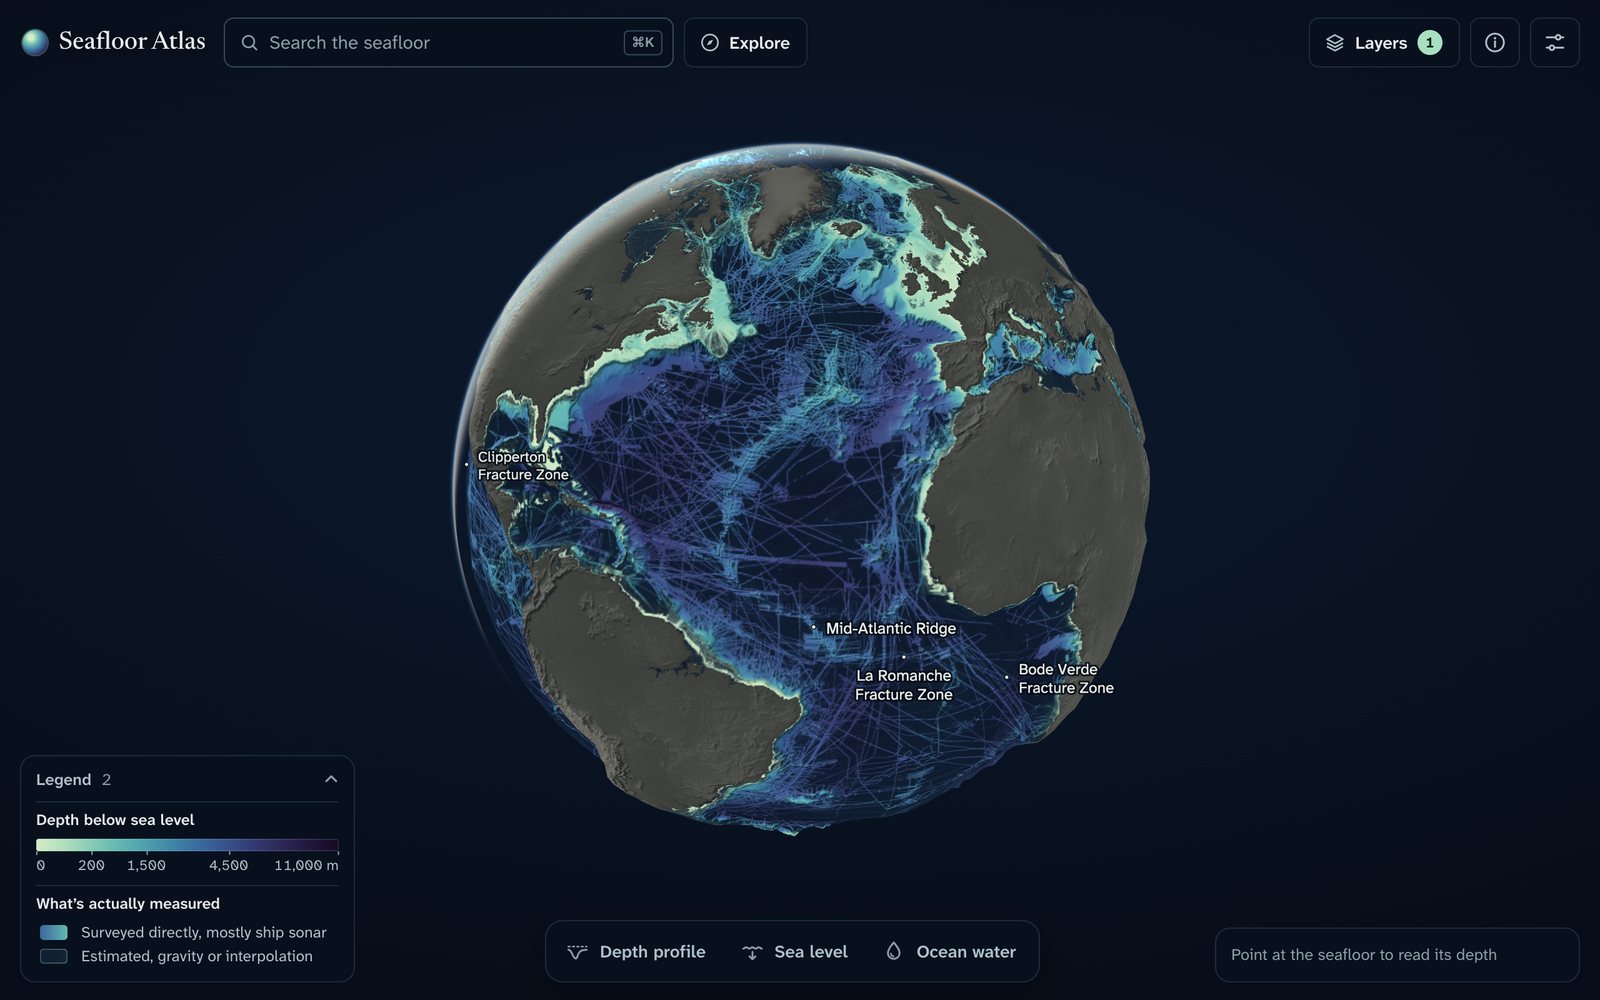
Seafloor Atlas is a free interactive 3D globe of the whole ocean floor, built from the GEBCO 2026 grid. It shows the shape of the seafloor and, for every place, whether its depth was measured by a ship or only estimated from space.
Open the 3D globe or take the 2-minute guided tour
Key numbers
| Ocean area | 361.7 million km² (70.9 % of Earth) |
| Seafloor directly measured, GEBCO 2026 | 30.8 % |
| Official Seabed 2030 figure (stricter rule) | 28.7 % |
| GEBCO 2025 → GEBCO 2026 | 29.7 % → 30.8 % (+4.1 million km²) |
| National waters (EEZs) vs high seas, measured | 38.0 % vs 26.4 % |
| Deepest places: median error of the grid vs surveys | 10 m |
| Ocean volume, mean depth | 1.338 billion km³, 3,702 m |
| Ocean area with no species record at all | 45 % |
All numbers are computed in the open source code from public data, area-weighted on the sphere.
What you can do on the globe
- See what is measured and what is only estimated, anywhere on Earth, down to 460 m detail.
- Draw a depth profile across a trench or ridge, for example across Challenger Deep (almost 11 km).
- Lower or raise the sea: at −120 m, the level of the last ice age, Sundaland, Sahul and Beringia become land.
- Look at the water: temperature, salinity and density from the surface to 5 km, month by month.
- Play time: earthquakes since 1900, internet cables, offshore wind farms and seafloor mapping 2019 → 2026.
- Follow winds, currents and phytoplankton through the seasons, and see marine life records and their gaps.
- Human activity at sea: submarine cables, shipping lanes, shipwrecks, oil and gas platforms, pipelines, wind farms.
Famous places on the seafloor
- Challenger Deep11.37° N, 142.59° E
- Mid-Atlantic Ridge and Iceland63.00° N, 25.00° W
- The Hawaiian–Emperor bend32.17° N, 173.00° E
- East Pacific Rise20.00° S, 113.67° W
- Tonga–Kermadec Trench23.26° S, 174.73° W
- Bahama Banks and the Great Bahama Canyon25.82° N, 76.99° W
- Monterey Canyon36.67° N, 122.08° W
- Drake Passage58.00° S, 63.00° W
- Gakkel Ridge84.74° N, 4.44° E
- Romanche Fracture Zone0.24° S, 18.54° W
- Measured vs. estimated: the MH370 search36.00° S, 93.00° E
Frequently asked questions
How much of the ocean floor has been mapped?
In the GEBCO 2026 grid, 30.8 % of the seafloor area is coded as directly measured by ships and other surveys (multibeam and single-beam sonar, lidar, seismic). The official Seabed 2030 figure for the same grid is 28.7 %; it uses a stricter, depth-dependent resolution rule. The rest of the seafloor is estimated from satellite gravity or interpolated between measurements.
Why is so little of the seafloor measured?
The ocean covers 361.7 million km² (70.9 % of Earth). A survey ship measures only a strip a few kilometres wide under its track, and most of the deep ocean is far from shipping lanes and coasts. The least-measured places are the abyssal plains (26.7 % at 4–5 km depth), the southern mid-latitudes (19–20 % at 40–50° S) and the high seas (26.4 %, against 38.0 % inside national waters).
How fast is the measured share growing?
Between GEBCO 2025 and GEBCO 2026 it went from 29.7 % → 30.8 %, +4.1 million km² in one year on the same ocean mask. Part of every release is also re-coded between "measured" and "estimated", which this atlas tracks release by release.
What is the deepest point of the ocean?
Challenger Deep, at the southern end of the Mariana Trench in the western Pacific, almost 11 km below sea level. At the 14 deepest places the GEBCO 2026 grid lies within a median of 10 m of published surveys.
How much water is in the ocean?
On the GEBCO 2026 grid the ocean holds 1.338 billion km³ with a mean depth of 3,702 m, within 0.5 % of an earlier published estimate (Charette and Smith 2010).
Where does the data come from?
Depth and the measured/estimated coding come from the GEBCO Compilation Group grids (2019–2026) and their Type Identifier grids. Other layers use World Ocean Atlas 2023 (temperature, salinity), NASA MODIS-Aqua (phytoplankton), NCEP/NCAR and OSCAR (winds, currents), USGS ComCat (earthquakes), OBIS and AquaMaps (marine life), Marine Regions (national waters), seamount catalogues, OpenStreetMap, Wikidata, the World Bank and TeleGeography. Each layer keeps its source licence.
Can I use the data and the code?
Yes. The code is MIT-licensed. Each data file keeps the licence of its source, listed per file in LICENSES.md; some layers are non-commercial or ShareAlike. The depths are not for navigation.
How do I cite Seafloor Atlas?
Ismoilov, O. (2026). Seafloor Atlas: an interactive globe of the whole ocean floor and how much of it has been measured (Version 1.3.0). Zenodo. https://doi.org/10.5281/zenodo.24287662. The concept DOI for all versions is 10.5281/zenodo.24228190. Please also cite GEBCO and the other data sources you use.
Is this an official GEBCO or Seabed 2030 product?
No. It is an independent open-source project built on their public data and is not endorsed by them.
For researchers
The measured share is computed from the public GEBCO Type Identifier grids of every release from 2019 to 2026 (codes 10–17 = direct measurement), on one fixed ocean mask, with every number traceable to a script. Code, derived data and figures are archived on Zenodo (doi:10.5281/zenodo.24287662, version 1.3.0; all versions doi:10.5281/zenodo.24228190). The cell-level record behind these numbers (one netCDF file on the native 15″ grid plus tables, CC BY 4.0) is archived at doi:10.5281/zenodo.24287579.
Ismoilov, O. (2026). Seafloor Atlas: an interactive globe of the whole ocean floor
and how much of it has been measured (Version 1.3.0). Zenodo. https://doi.org/10.5281/zenodo.24287662

Dataset: Ismoilov, O. (2026). A cell-level record of directly measured seafloor
in the GEBCO grid releases 2019–2026 (Version 1.0.0). Zenodo. https://doi.org/10.5281/zenodo.24287579